左手's Blog
我是左手,行走在路上!
js点阵绘制5边形
更新说明:
2013-05-27 上传到gitcafe上面拖管 https://gitcafe.com/lcc/somecode/tree/master/jsdraw
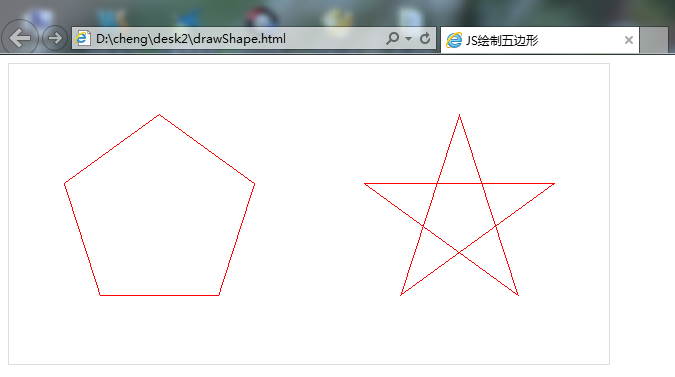
写了一段生成象素点来绘制5边形的代码。用到了 Bresenham斜线画法、三角函数等知识。代码如下:
<!DOCTYPE html>
<html lang="zh-cn">
<head>
  <meta charset="UTF-8">
  <title>JS绘制五边形</title>
  <style type="text/css">
    .paper {
      width: 600px;
      height: 300px;
      border-color: #E0E0E0;
      border: 1px solid #DDD;
      position: relative;
    }
    .point {
      width: 1px;
      height: 1px;
      position: absolute;
      overflow: hidden;
      display: block;
      zoom: 1;
    }
    .red {
      background-color: red;
    }
  </style>
  <script type="text/javascript">
    // 画斜线
    function drawLine(point1, point2) {
      var point, pointElem, paper;

      pointElem = document.createElement('div');
      if ('className' in pointElem) {
        pointElem.className = 'point red';
      }
      else {
        pointElem.setAttribute('class', 'point red');
      }

      paper = document.getElementById('paper');

      var xLen = Math.abs(point2[0] - point1[0]);
      var yLen = Math.abs(point2[1] - point1[1]);
      var x, y, cx, cy, tox, toy, rate, rateVal, isAdd = true;
      // 从x轴遍历
      if (xLen >= yLen) {
        if (point1[0] > point2[0]) { point1 = [point2, point2=point1][0]; }
        if (point1[1] > point2[1]) { isAdd = false; }

        x = cx = point1[0];
        y = cy = point1[1];
        tox = point2[0];
        toy = point2[1];

        rateVal = rate = parseInt( (yLen / xLen) * 1000)
        for (var i=x; i<tox; i++) {
          cx = i;
          point = pointElem.cloneNode();
          paper.appendChild(point);
          point.style.left = cx + 'px';
          point.style.top = cy + 'px';
          rateVal += rate
          if (rateVal >= 1000) {
            cy += isAdd ? 1 : -1
            rateVal -= 1000;
          }
        }
      }
      // 从y轴遍历
      else {
        if (point1[1] > point2[1]) { point1 = [point2, point2=point1][0]; }
        if (point1[0] > point2[0]) { isAdd = false; }

        x = cx = point1[0];
        y = cy = point1[1];
        tox = point2[0];
        toy = point2[1];

        rateVal = rate = parseInt( (xLen / yLen) * 1000)
        for (var i=y; i<toy; i++) {
          cy = i;
          point = pointElem.cloneNode();
          paper.appendChild(point);
          point.style.left = cx + 'px';
          point.style.top = cy + 'px';
          point = null
          rateVal += rate
          if (rateVal >= 1000) {
            cx += isAdd ? 1 : -1
            rateVal -= 1000;
          }
        }
      }
      // 补点
      if (cx != tox || cy != toy) {
        point = pointElem.cloneNode();
        paper.appendChild(point);
        point.setAttribute('style', 'left:' + tox + 'px; top:' + toy + 'px');
        point = null
      }
      pointElem = null;
    }
    // 获取点信息
    function getPointInfo(R, dot) {

      var A = 360 / 5
      var sinLen = Math.sin(A / 180 * Math.PI) * R
      var cosLen = Math.cos(A / 180 * Math.PI) * R
      sinLen = Math.round(sinLen)
      cosLen = Math.round(cosLen)

      var point1 = [dot[0], dot[1] - R]
      var point2 = [dot[0] + sinLen, dot[1]- cosLen]
      var point5 = [dot[0] - sinLen, dot[1] - cosLen]

      var A2 = (180 - A) / 2
      sinLen = Math.sin(A2 / 180 * Math.PI) * R
      cosLen = Math.cos(A2 / 180 * Math.PI) * R
      sinLen = Math.round(sinLen)
      cosLen = Math.round(cosLen)

      var point3 = [dot[0] + cosLen, dot[1] + sinLen]
      var point4 = [dot[0] - cosLen, dot[1] + sinLen]

      return [point1, point2, point3, point4, point5];
    }
    // 画点
    function drawShape(type, R, dot) {
      var pointInfo = getPointInfo(R, dot)
      var point1 = pointInfo[0];
      var point2 = pointInfo[1];
      var point3 = pointInfo[2];
      var point4 = pointInfo[3];
      var point5 = pointInfo[4];
      // 五边形
      if (type == 1) {
        drawLine(point1, point2);
        drawLine(point2, point3);
        drawLine(point3, point4);
        drawLine(point4, point5);
        drawLine(point5, point1);
      }
      // 五角星
      else if (type == 2){
        drawLine(point1, point3);
        drawLine(point3, point5);
        drawLine(point5, point2);
        drawLine(point2, point4);
        drawLine(point1, point4);
      }
    }

    window.onload = function () {
      drawShape(1, 100, [150, 150])
      drawShape(2, 100, [450, 150])
    }
  </script>
</head>
<body>
  <div id="paper" class="paper"></div>
</body>
</html>
效果图: